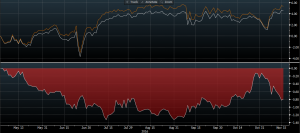
As of 11/16, the SMIF Portfolio is holding an asset allocation of 2.55% Cash, 11.87% Fixed Income, and 85.62% Equity. This asset allocation has been fairly in line with the tactical benchmark we set at the beginning of the semester (87.5% Equity and 12.5% Fixed Income.) However, currently we have a larger than normal cash position due to the sale of a position from November 8 that will likely be reinvested in the near future. Since taking control of the SMIF portfolio on April 29, 2016, the Portfolio has achieved a total return of 4.59%. This trails our strategic benchmark by 80 basis points. The comparison can be seen in the graph below. Our strategic benchmark is a blended benchmark consisting of 90% S&P 500 Index and 10% Barclays US Aggregate Bond Index. The majority of the return achieved from April 29th can be attributed to the Financial and Information Technology sectors of the SMIF portfolio.
Graph 1: SMIF vs. Blended Benchmark 04/29/2016-11/15/2016
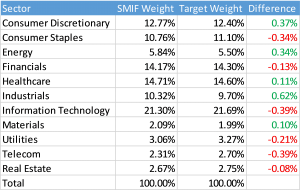
In the early part of the semester, SMIF selected target sector weightings for the equity position of the portfolio. The current weightings and targets can be seen in the table below.The orange line represents the blended benchmarks perforemance. The white indicates the SMIF portoflio’s performance. The red indicates by how much the SMIF portfolio’s performance has been trailing behind the performance of the blended benchmark.
Figure 1: SMIF Equity Sector Weightings 11/15 Compared to SMIF Sector Targets


